Building sys-monitor: A Fast, Minimal Terminal System Monitor in Rust
When it comes to system monitoring, developers often face a common dilemma: modern GUI tools are notoriously resource-heavy, while traditional command-line utilities can be clunky, visually unappealing, or lacking in real-time clarity. We need software that respects our system’s resources while providing instant, actionable insights.
That is why I created sys-monitor—a fast, minimal terminal system monitor built from the ground up using Rust and the elegant Ratatui ecosystem. It is designed to give you clarity on your machine’s performance in seconds, with zero bloat and a pristine, keyboard-first interface.
Why Build Another System Monitor?
The core philosophy behind sys-monitor is simple: Just signal. No noise.
Many existing monitoring tools suffer from information overload, slow performance, or poor visual hierarchy. As engineers, we need instant, at-a-glance metrics without parsing through confusing data tables or waiting for a heavy Electron app to load.
By leveraging Rust’s zero-cost abstractions and memory safety guarantees, sys-monitor achieves:
- Sub-millisecond Render Loops: Delivering incredibly smooth real-time updates.
- Microscopic Footprint: It consumes less than 15 MB of memory under normal operation.
- Instant Startup: Launch the app and see your metrics in under 200ms.
Key Features Built for Power Users
The application is structured around a few carefully designed components, ensuring you get exactly what you need when you pull up your terminal.
Comprehensive CPU and Memory Metrics
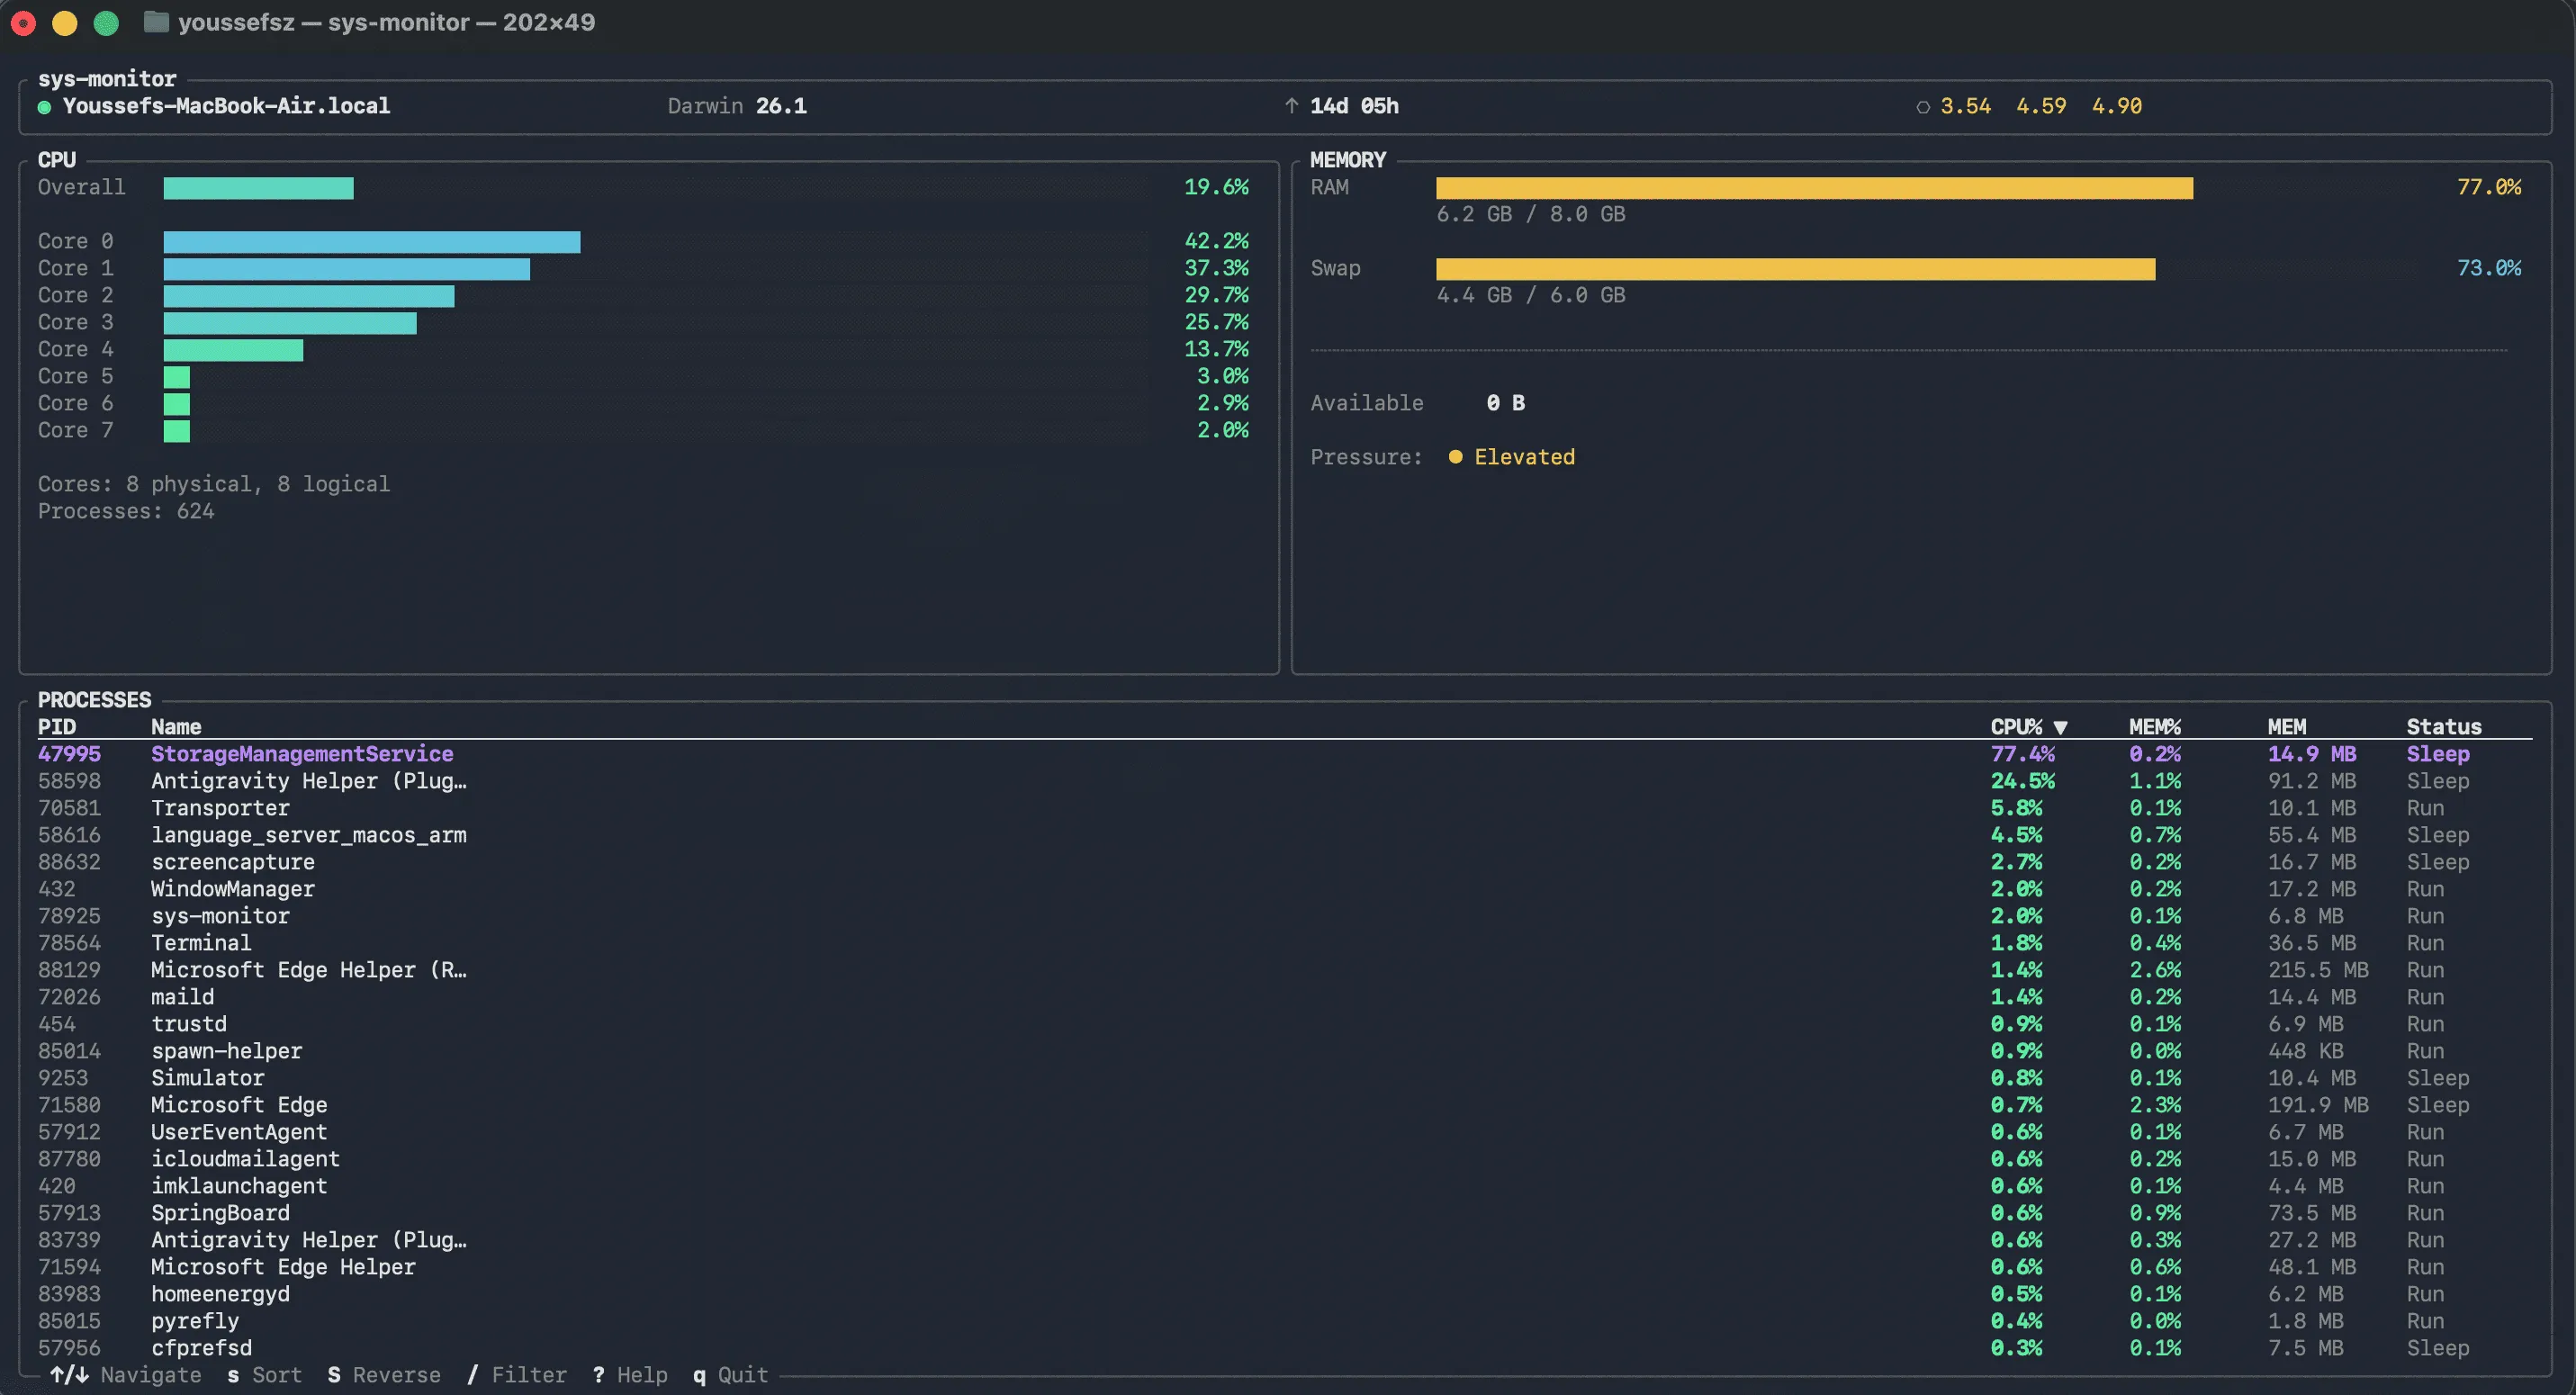
The CPU Monitoring panel features an aggregate usage bar with an optional per-core breakdown, using color-coded severity metrics—ranging from cool idle greens to critical reds. Down below, the Memory Panel provides exact insights into your RAM and swap usage with human-readable values, so you always know what is consuming your system resources.
Interactive Process Table
An actively sorting, real-time Process Table allows you to view your top processes by CPU or memory consumption. You can easily filter processes by name, making it effortless to track down resource-hungry or misbehaving applications.
Keyboard-First Ergonomics
Terminal users love their keyboards, and sys-monitor is completely tailored to that workflow. Full navigation—including sorting, filtering, scrolling, and quitting—can be executed without ever touching a mouse. Everything is highly accessible; just tap ? to bring up the contextual help menu at any time.
Always-Visible Host Info
Your machine’s vital statistics—hostname, OS version, uptime, and load averages—are permanently pinned to the header bar, providing constant context for the metrics in the main view.
Installing sys-monitor
The tool is natively compiled for optimal performance and supports cross-platform usage across macOS, Linux, and Windows. You can install it on UNIX-like environments in seconds using our automated installation script:
curl -sSL https://raw.githubusercontent.com/youssefsz/sys-monitor-Rust/master/install.sh | bashFor Windows users, you can run our automated PowerShell script:
powershell -Command "irm https://raw.githubusercontent.com/youssefsz/sys-monitor-Rust/master/install.ps1 | iex"Alternatively, you can dive into the source code, review full package instructions, and check out the official documentation.
If you are a developer looking to contribute, audit the code, or just support the project, check out the sys-monitor GitHub Repository. Let’s continue pushing the boundaries of what lightweight, terminal-based applications can achieve.